Veeam Service Providers Best Practice Site
Monitoring - Dashboards
In Veeam ONE, dashboards are providing at-a-glance views of a monitored infrastructure. Each dashboard consists out of widgets, which portray various aspects of the environment. For internal infrastructure, with unlimited scope, there are more than 50 different widgets that you can combine. We will focus on the representation of a customer in an IaaS infrastructure.
When the tenant logs into the Veeam ONE Web Client using the VMware Cloud Director account, all shared dashboards will be presented. However, most of the widgets will be unavailable due to restrictions. These restrictions generally cause confusion and discourage the customer from using the Web Client.
To improve user experience, complete a few steps in advance:
-
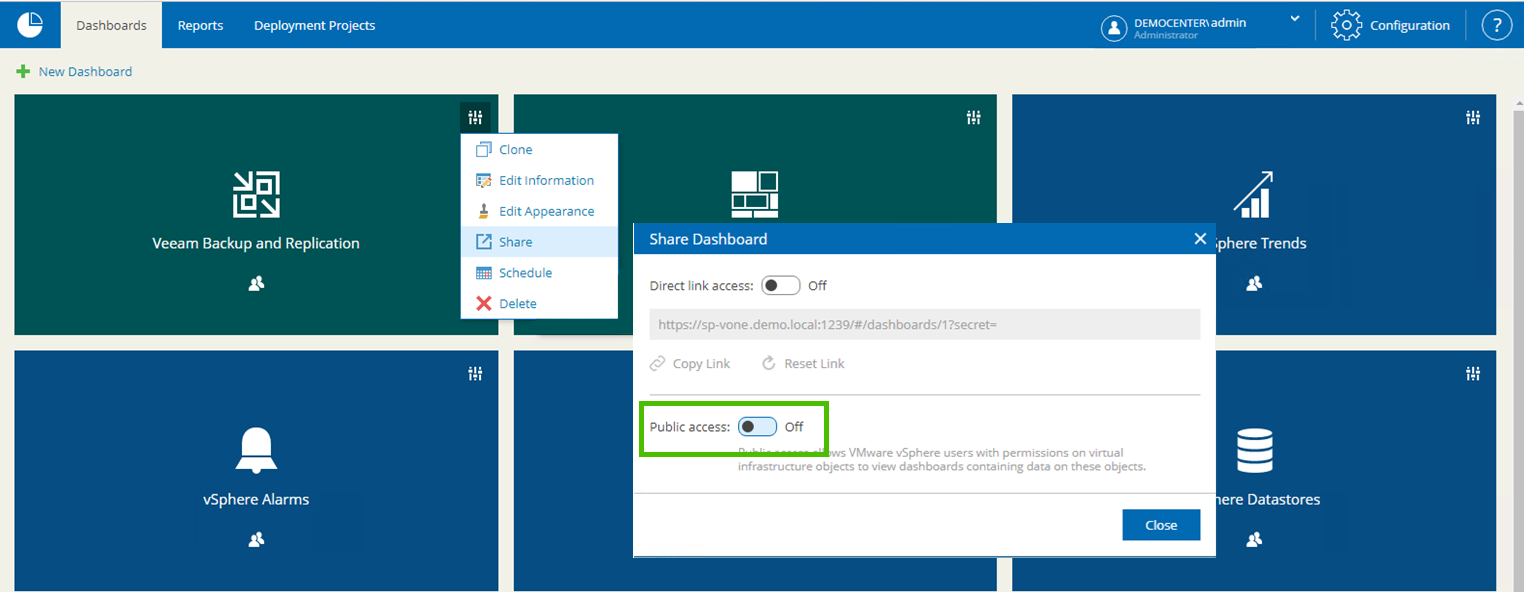
Log in with Veeam ONE administrator credentials and turn off sharing for all default dashboards. It will hide unnecessary dashboards for tenants with Restricted view.
-
Create new dashboards that will be shared with customers. We recommend creating at least two:
[Tenant – Monitoring]
[Tenant – Performance]Later we will populate them with widgets. If needed, you can customize appearance of dashboards (preview image and color)
-
Enable [public access to tenant dashboards].(https://helpcenter.veeam.com/docs/one/reporter/share_dashboard.html). That will make dashboard visible for tenants with Restricted view.
-
Populate Dashboards with the following widgets.
Tenant – Monitoring
The below is a list of recommended dashboards for Monitoring various states by tenant
Monitoring dashboard (preview)
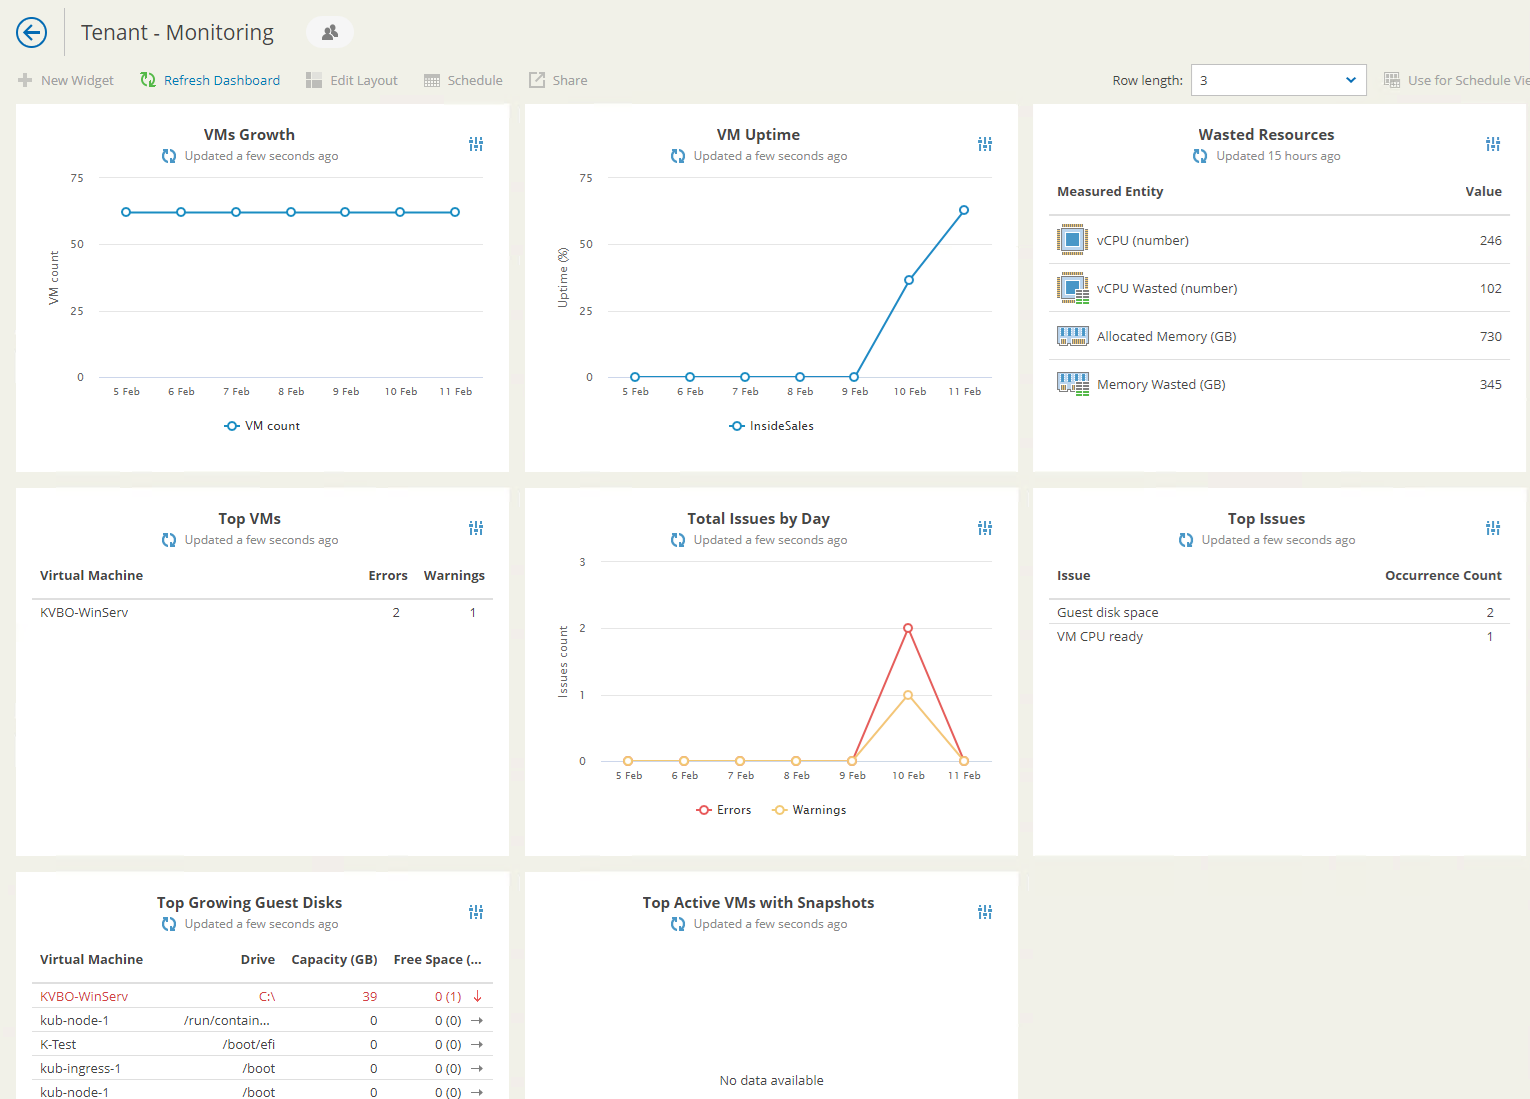
Widget Pack Widget vSphere Alarms Total Issues by Day Daily number of warnings and errors that were triggered during the week vSphere Alarms Top Issues Most typical alarms in your environment and shows the number of times each alarm was triggered vSphere Alarms Top VMs VMs with the highest number of registered errors and warnings vSphere Datastore Space Usage Top Growing Guest Disks VMs with the least amount of free guest disk space vSphere Datastore Space Usage Top Active VMs with Snapshots VMs with the largest snapshots vSphere General Information VMs Growth Number of VMs in your virtual infrastructure vSphere General Information VM Uptime The average uptime value for VM vSphere General Information Wasted Resources Amount of over-provisioned resources in your environment Tenant – Performace
The below is a list of recommended dashboards for Monitoring VMs performance by tenant
Performace dashboard (preview)
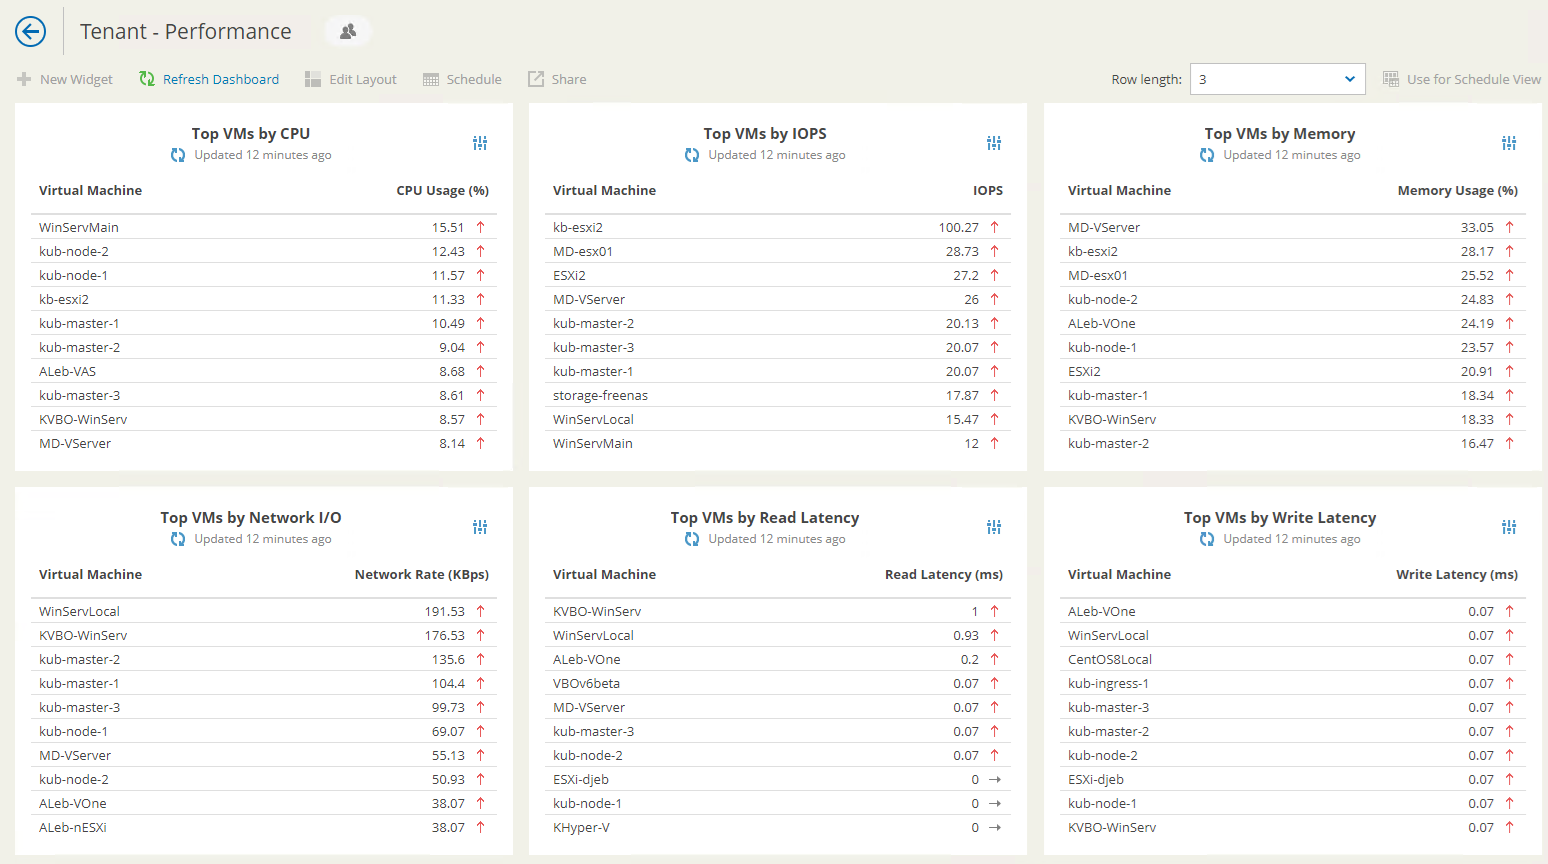
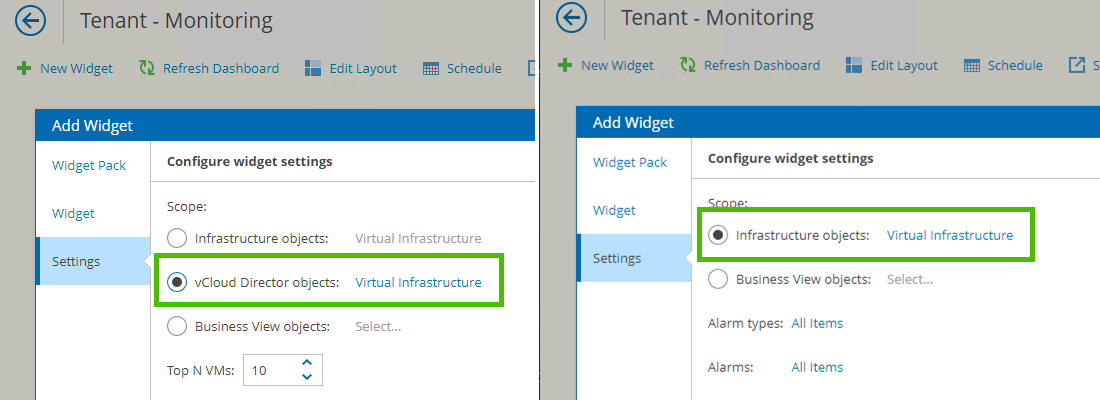
Widget Pack Widget vSphere General Information Top VMs by CPU Highest average level of CPU utilization vSphere General Information Top VMs by IOPS Highest average number of IOPS vSphere General Information Top VMs by Memory Highest average level of memory utilization vSphere General Information Top VMs by Network I/O Highest average network throughput values vSphere General Information Top VMs by Read Latency Highest average Read Latency metric values vSphere General Information Top VMs by Write Latency Average Write Latency metric values vSphere General Information VM Uptime The average uptime value for VM vSphere General Information Wasted Resources Amount of over-provisioned resources in your environment NOTE: When adding a new widget, select scope VMware Cloud Director objects: Virtual Infrastructure where applicable. For widgets without VMware Cloud Director scope: select Infrastructure objects: Virtual Infrastructure.
-
Log in to the Veeam ONE Web Client with tenant credentials.
As a tenant you can see only shared dashboards.NOTE: Each dashboard will represent information only for the scope of VMs, where the tenant will have System Administrator role.
Even tenants without the VCD Organization Administrator role can benefit from the portal.
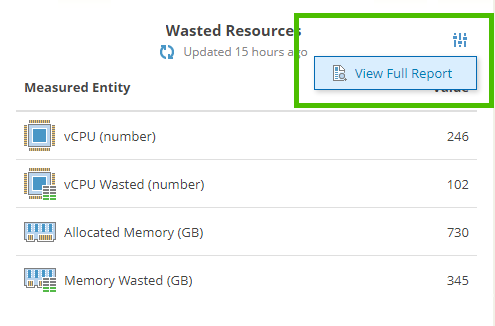
For most widgets, it is possible to generate an associated report just with a couple of clicks. At the top right corner of the widget, expand the menu and click View Full Report. Select the correct scope and other parameters where applicable and run the preview.